Originally published on Medium in Indonesian. Translated to English.
This article was originally written as the publication for the capstone project of the Data Science Learning Studio bootcamp, run by Data Science Indonesia (DSI), the largest data science community in Indonesia. My team was given the chance to analyze disaster data from PetaBencana and flood data from BNPB.
In this article I’ll go through what we learned from the dataset provided by the National Disaster Management Agency (BNPB).
Before the main discussion, let’s get to know this agency first.
BNPB (Badan Nasional Penanggulangan Bencana) is a non-ministerial government institution tasked with assisting the President of the Republic of Indonesia in disaster management, in line with Law Number 24 of 2007 on Disaster Management. More details are on the official BNPB website.¹
As a refresher, let’s recall what Exploratory Data Analysis is.
Exploratory Data Analysis is an important step in any research analysis. The main goal of exploratory analysis is to examine the data for distributions, outliers, and anomalies so that you can direct specific tests of your hypothesis. It also provides tools for generating hypotheses by visualizing and understanding the data, usually through graphical representations.²
Data Understanding
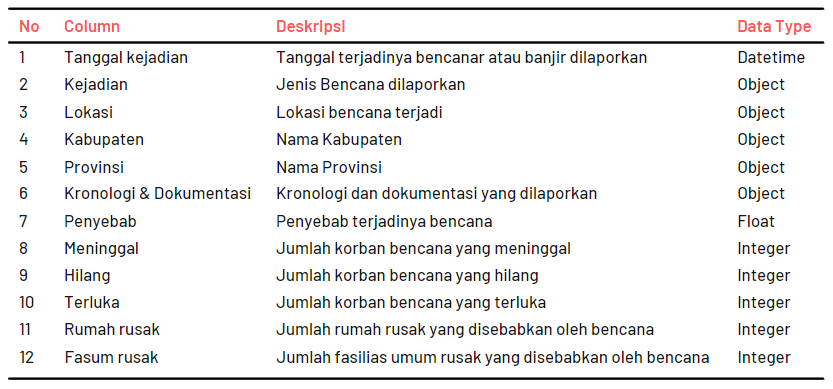
Before running EDA, we need to understand the data we have and know what information a tabular dataset can give us, starting with the columns in the BNPB data.
The BNPB data is a set of flood reports collected by BNPB from various regions over the 2020-2021 period.
Here are the columns and their descriptions:
Exploratory Data Analysis (EDA)
At this stage I focused on exploring flood events, their timeline, and the impact of the disaster. So not every column in the dataset is used. These are the columns used in this EDA:
- Date of Event (Tanggal Kejadian)
- Event (Kejadian)
- Deaths (Meninggal)
- Missing (Hilang)
- Injured (Terluka)
- Damaged Houses (Rumah Rusak)
- Damaged Public Facilities (Fasum Rusak)
During the EDA I found a few interesting insights, explained in the following subsections.
Floods Happen Mostly at the Start and End of the Year
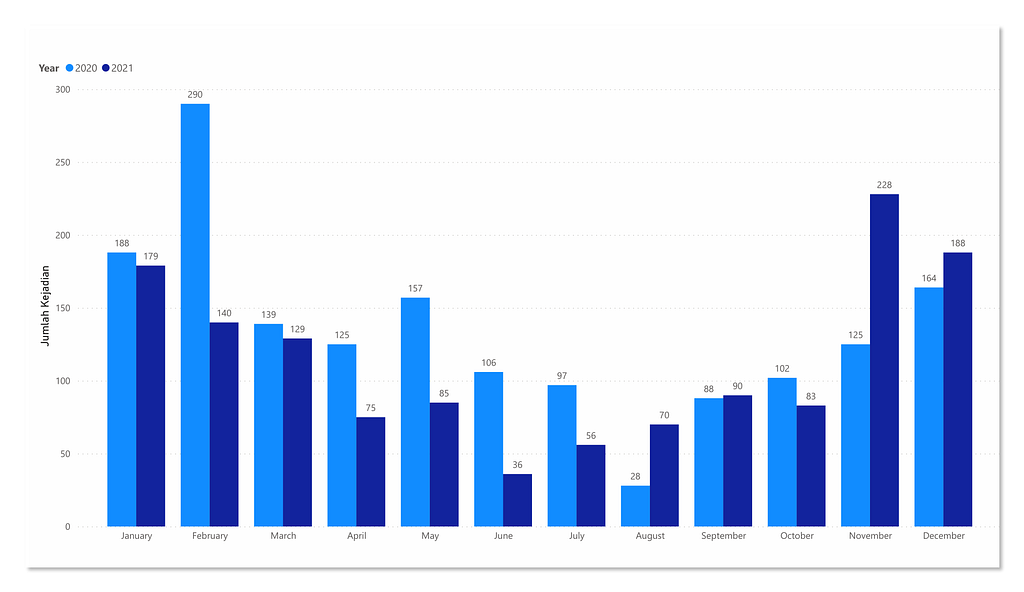
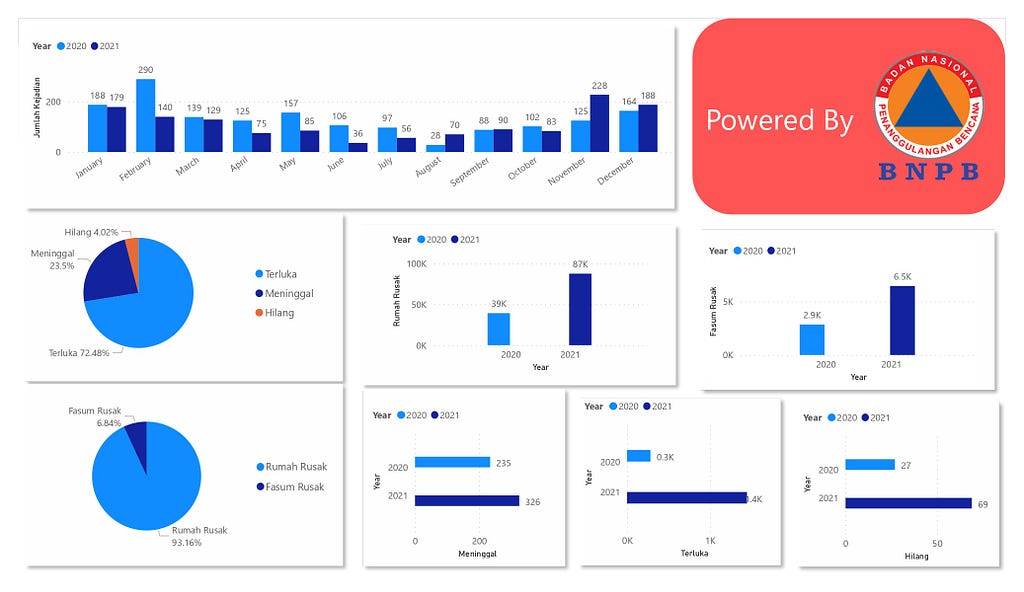
Based on the bar chart timeline above, flood events dropped at the beginning of 2021 compared with the previous year, but toward the end of the year the number of floods exceeded the previous year, specifically in September, November, and December. The biggest increase was in November, at 82%: there were 125 events in 2020 versus 228 in 2021. Over these two years, floods also occurred more often at the beginning and at the end of the year.
Damaged Houses and Injured People Are the Biggest Impacts
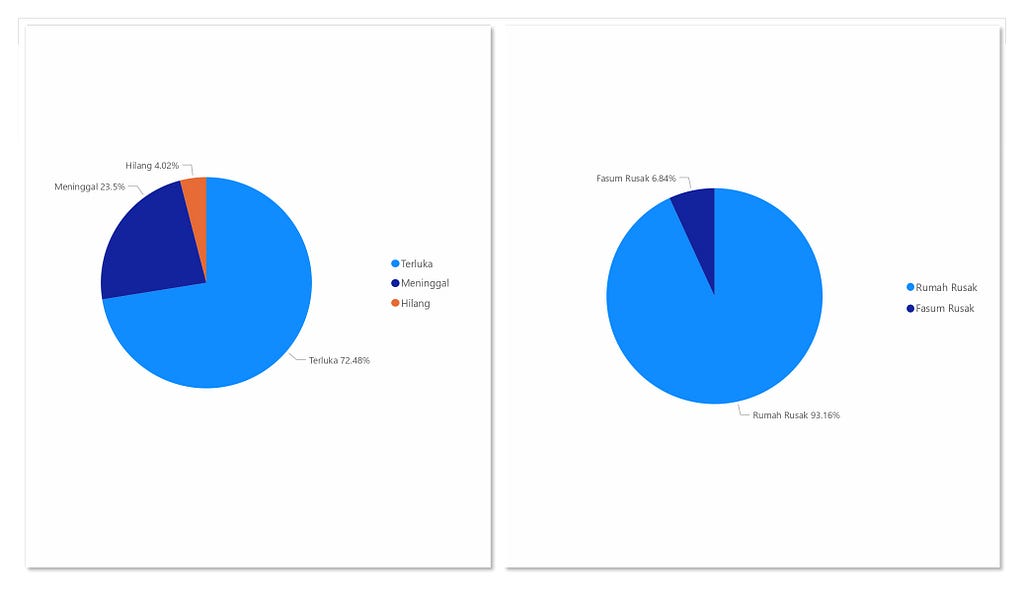
In the BNPB data, I split the impact of floods into two types: impact on people (casualties) and impact on buildings (material damage).
Among casualty impacts, the largest is injured people, at 1,730. Among material damage, the largest is damaged houses, at 126,671 houses.
Fewer Floods, but Greater Impact
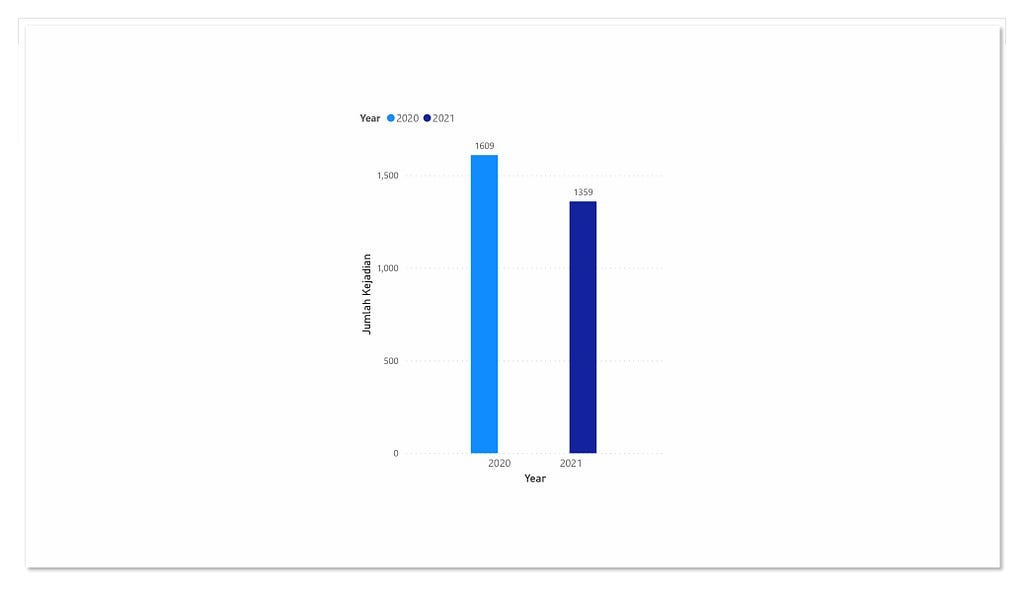
Over the last two years the number of flood events fell by 15.5%: there were 1,609 events in 2020 and 1,359 in 2021. But the drop doesn’t apply to the impact. Here is a comparison of all impacts over the two years:
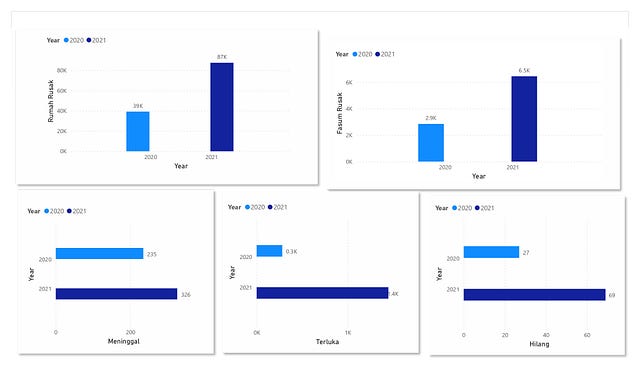
From the chart, every impact increased compared with the previous year. Casualties in 2021 tripled compared with 2020, and material damage doubled.
Dashboard
All the visualizations in this article are presented in a dashboard built with Power BI.
References
[1] Indonesian National Board for Disaster Management (Wikipedia)
[2] Chong Ho, Yu. 2010. “Exploratory data analysis in the context of data mining and resampling”. International Journal of Psychological Research. 3(1), 9-22.